TRON (TRX) price fails to break the $0.07 level repeatedly!
Most content on the internet is controlled by Google, Facebook, and YouTube. They impose censorship on the content, which is often not fair for the content creators. TRON aims to solve the problem with a decentralized ecosystem where they allow content creators to deal directly with the consumers without any censorship or middleman. TRON allows users to access and share digital content with peer-to-peer technology to meet their goals.
It is a dedicated internet infrastructure that allows direct interaction between the content creators or resources and the end users. It helps the users in the following ways:-
- Decentralize the internet.
- Create digital content without worrying about censorship.
- Take the benefits of the digital marketplace.
- It also has a mobile app marketplace.
- Create tokens without territorial restrictions.
TRX is a native cryptocurrency that is also known as Tronix or TRON coin, based on the TRC-10 network. It can handle over 2000 transactions per second and support dApps in the TRON ecosystem. It is a far better option than BTC and ETH because Bitcoin can process only 5 transactions/second, whereas Ethereum processes 20 transactions/second.
TRON was established in 2017 by Justin Sun. It was backed by TRON Foundation, a Singapore-based non-profit organization that operates the network. It focuses mainly on network transparency to ensure long-term sustainability and equal opportunity for content creators and users.
Indeed, market experts believe TRON is a high-growth crypto network with wide use cases. That makes it one of the preferred choices for crypto enthusiasts. Please read our technical analysis before investing in TRX.
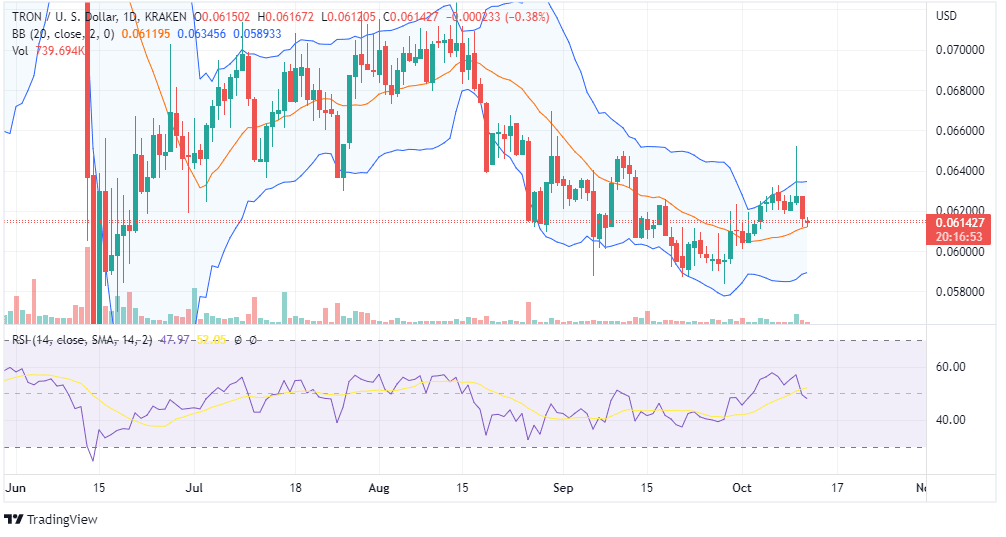
At the time of writing this post, TRX was trading around $0.061, which is forming higher highs after a short consolidation phase. On the downside, the price of TRON might take support around the baseline of $0.059, but $0.07 is the resistance that makes a good opportunity to invest for the short term.
Candlesticks are forming in the upper Bollinger Bands with positive MACD and RSI that suggest bullishness for the short term. You should invest with a target and a stop loss.
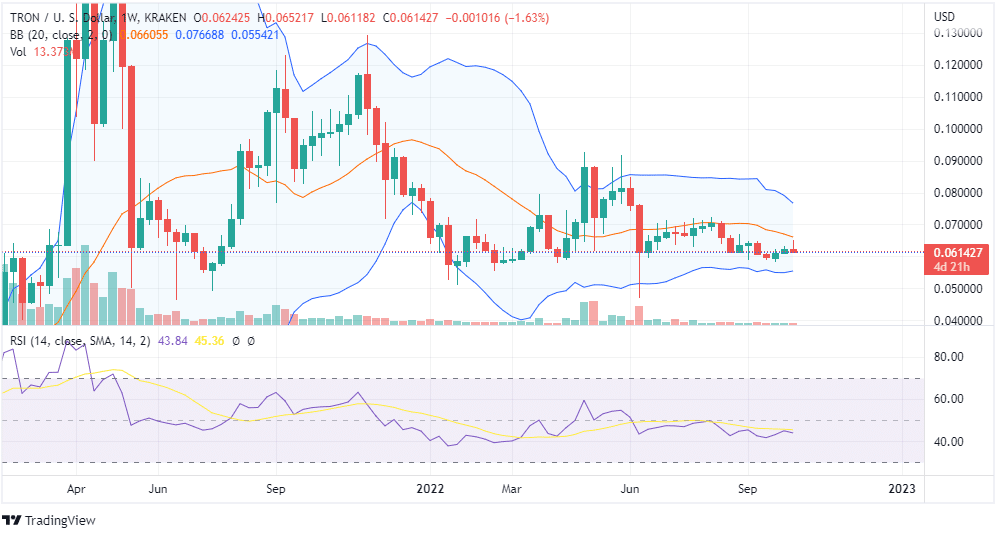
On the weekly chart, TRX candlesticks are in the lower Bollinger Bands forming lower lows that suggest extreme bearishness for the long term, and you should not invest until it crosses the resistance level decisively. You can add TRX to your watch list to track the price for your investments.

Related articles